


Most speed work on a WordPress site is about the site’s own code: fewer render-blocking files, a cached page, smaller images. Then a tag manager arrives, an analytics tag, an ad pixel or two, and the page that tested well yesterday is waiting for servers you do not run. Analytics is the script nobody wants to remove, because it is how you find out whether the rest of the work paid off.
So it is worth asking what measuring visitors really has to cost a page. In this article we look at where the weight of third-party tags comes from, and then measure what self-hosted WordPress analytics adds instead, using the tracker we build ourselves, Must-Have Analytics, on our WooCommerce test shop.
What a third-party tag costs
A script from another domain usually starts with a new connection: a DNS lookup, a TCP and TLS handshake, then the download. None of it comes from your page cache or your CDN, and its size and behaviour change whenever the vendor ships an update, without a release on your side.
Once it arrives, it runs on the same main thread as your page. A tag manager is a script whose job is to load more scripts, so one line in the header can become several files from several domains. Ad pixels bring their own libraries, and many tags attach listeners for clicks and scrolling on every page.
The usual fix is to delay all of it until the visitor interacts with the page. That helps the page, but it has a downside: visitors who leave before the tags run are not counted, so the numbers you base decisions on get quietly worse. We do not put a single figure on third-party tags here, because it depends on which tags you have and how they are set up. Open your browser’s network panel, filter for third-party requests and count them on your own site.
Measuring from your own site
Must-Have Analytics is a WordPress plugin that records visits in your own database. The page gets one small script from your own domain. It notes the page, the referrer, the time on page, how far the visitor scrolled and a few speed timings, and sends them to a REST API endpoint on your own site. The plugin does not add Google, Meta or TikTok scripts to the page.
Store events do not depend on the script. Add to cart, checkout, new orders, refunds, applied coupons and failed payments are recorded from WooCommerce’s own hooks on the server, in the request where they happen. And if you exclude your own user or role in the settings, the script is not printed for you, so your own visits add nothing to the page and stay out of the numbers.
What we measured on our test shop
We loaded the homepage of our WooCommerce test shop in a fresh browser and recorded every request. The test site runs a development copy of the plugin, so we served the tracker file from the released 1.0.6.1 package in its place. This is what the tracker added:
- One script file of 5.4 KB before compression, from the shop’s own domain. No request went to another domain.
- A first data request of under 400 bytes, about ten seconds after the script started, long after the page had finished loading.
- A second request of under 400 bytes, sent with
sendBeaconwhen we left the page.
With the Swift Performance AI cache and JavaScript optimisation active on the same shop, the tracker was delayed like the other scripts and loaded right after the page’s load event.
One thing we want to be clear about: the data requests are not free on the server. Each one goes to the WordPress REST API, which loads WordPress and writes a few rows, and no page cache can answer it. The work moves from the visitor’s browser to your server. We think that is the better place for it, but on a busy site it is real PHP work, and you should count it.
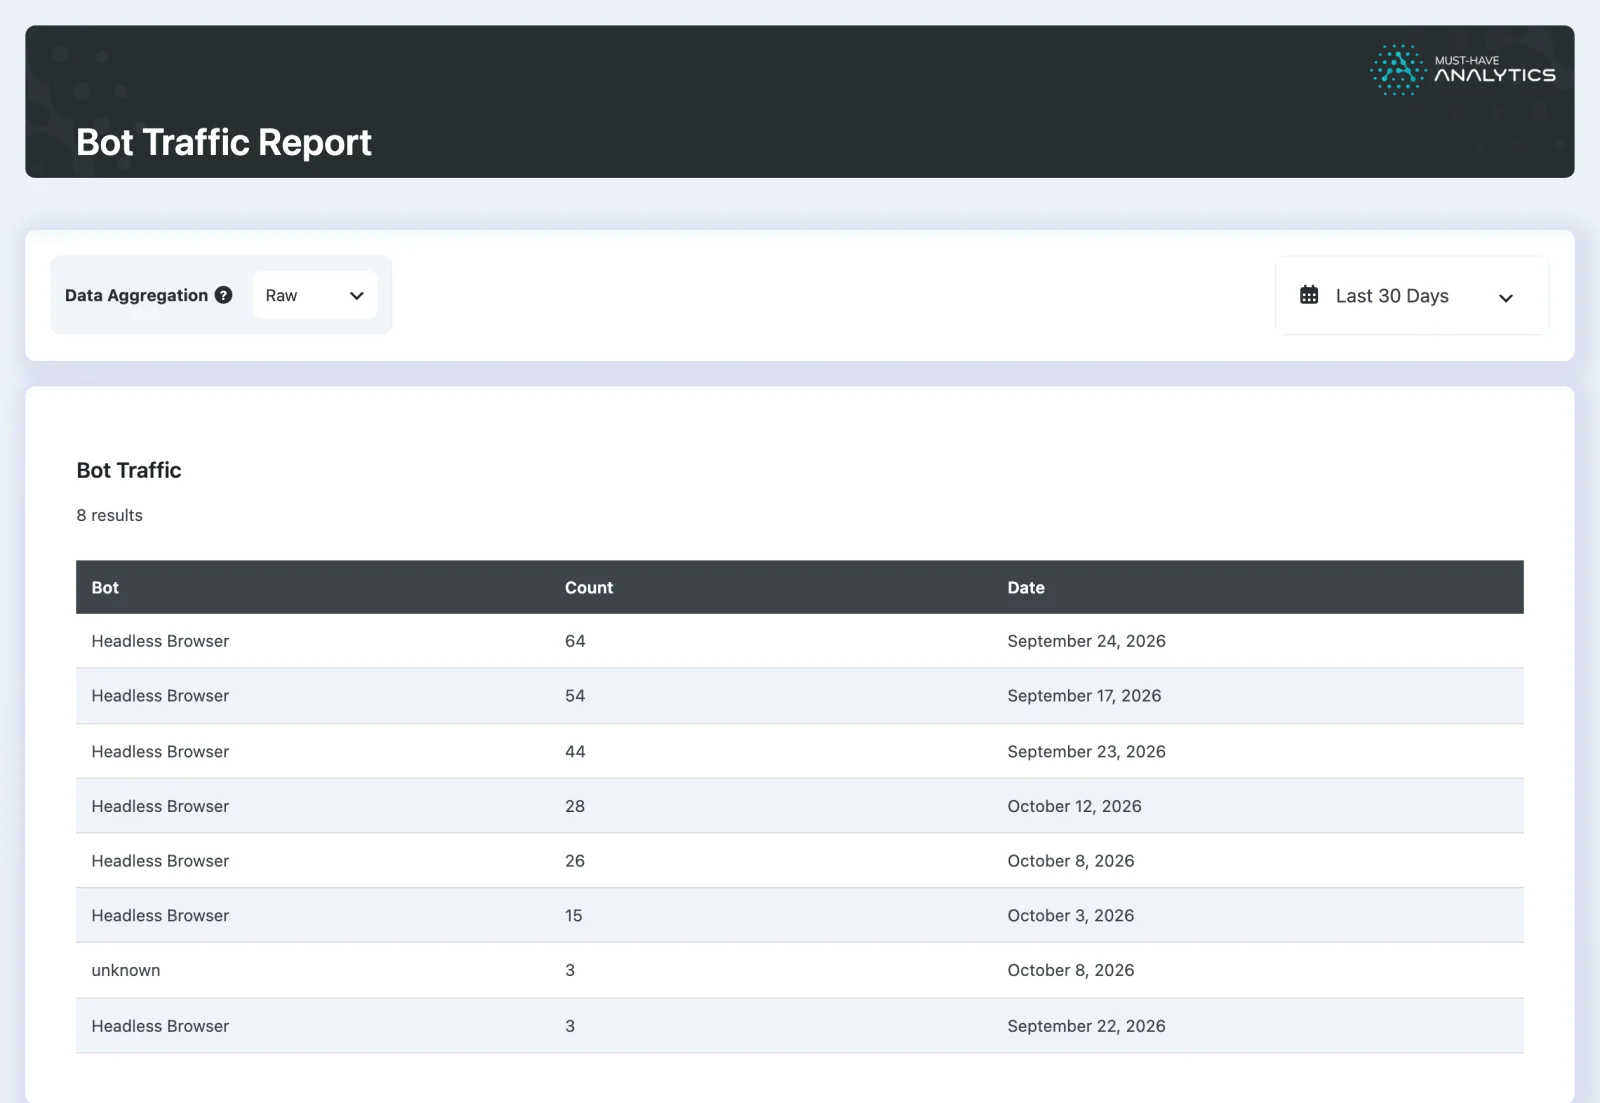
Bots get a shortcut. By default the plugin recognises automated visitors, headless browsers included, and keeps only a daily hit count per user agent instead of a session for every visit. On our test shop, the automated browsers we run for tests and screenshots ended up in the Bot Traffic report and not in the visitor numbers.
Speed data from real visits, including cache hits
Since the script is on the page anyway, it also reads the browser’s own performance timings: Largest Contentful Paint, First Contentful Paint, Cumulative Layout Shift and Time to First Byte. The dashboard shows the 75th percentile of each for the selected period, and the Web Vitals report shows them day by day, with filters for country, device, operating system and user agent.
For a caching blog, the most useful number is Cache Hit. Every page carries the time its HTML was generated. When the visit is recorded, the plugin compares that time with the moment the visitor opened the page, and if the HTML was more than two minutes old, the view counts as served from a cache. It is an approximation, since a page cached less than two minutes earlier counts as uncached, but it comes from real visits, not from the few URLs you happened to test. After you change cache settings or exclusions, this is where you see whether real visitors still get cached pages.
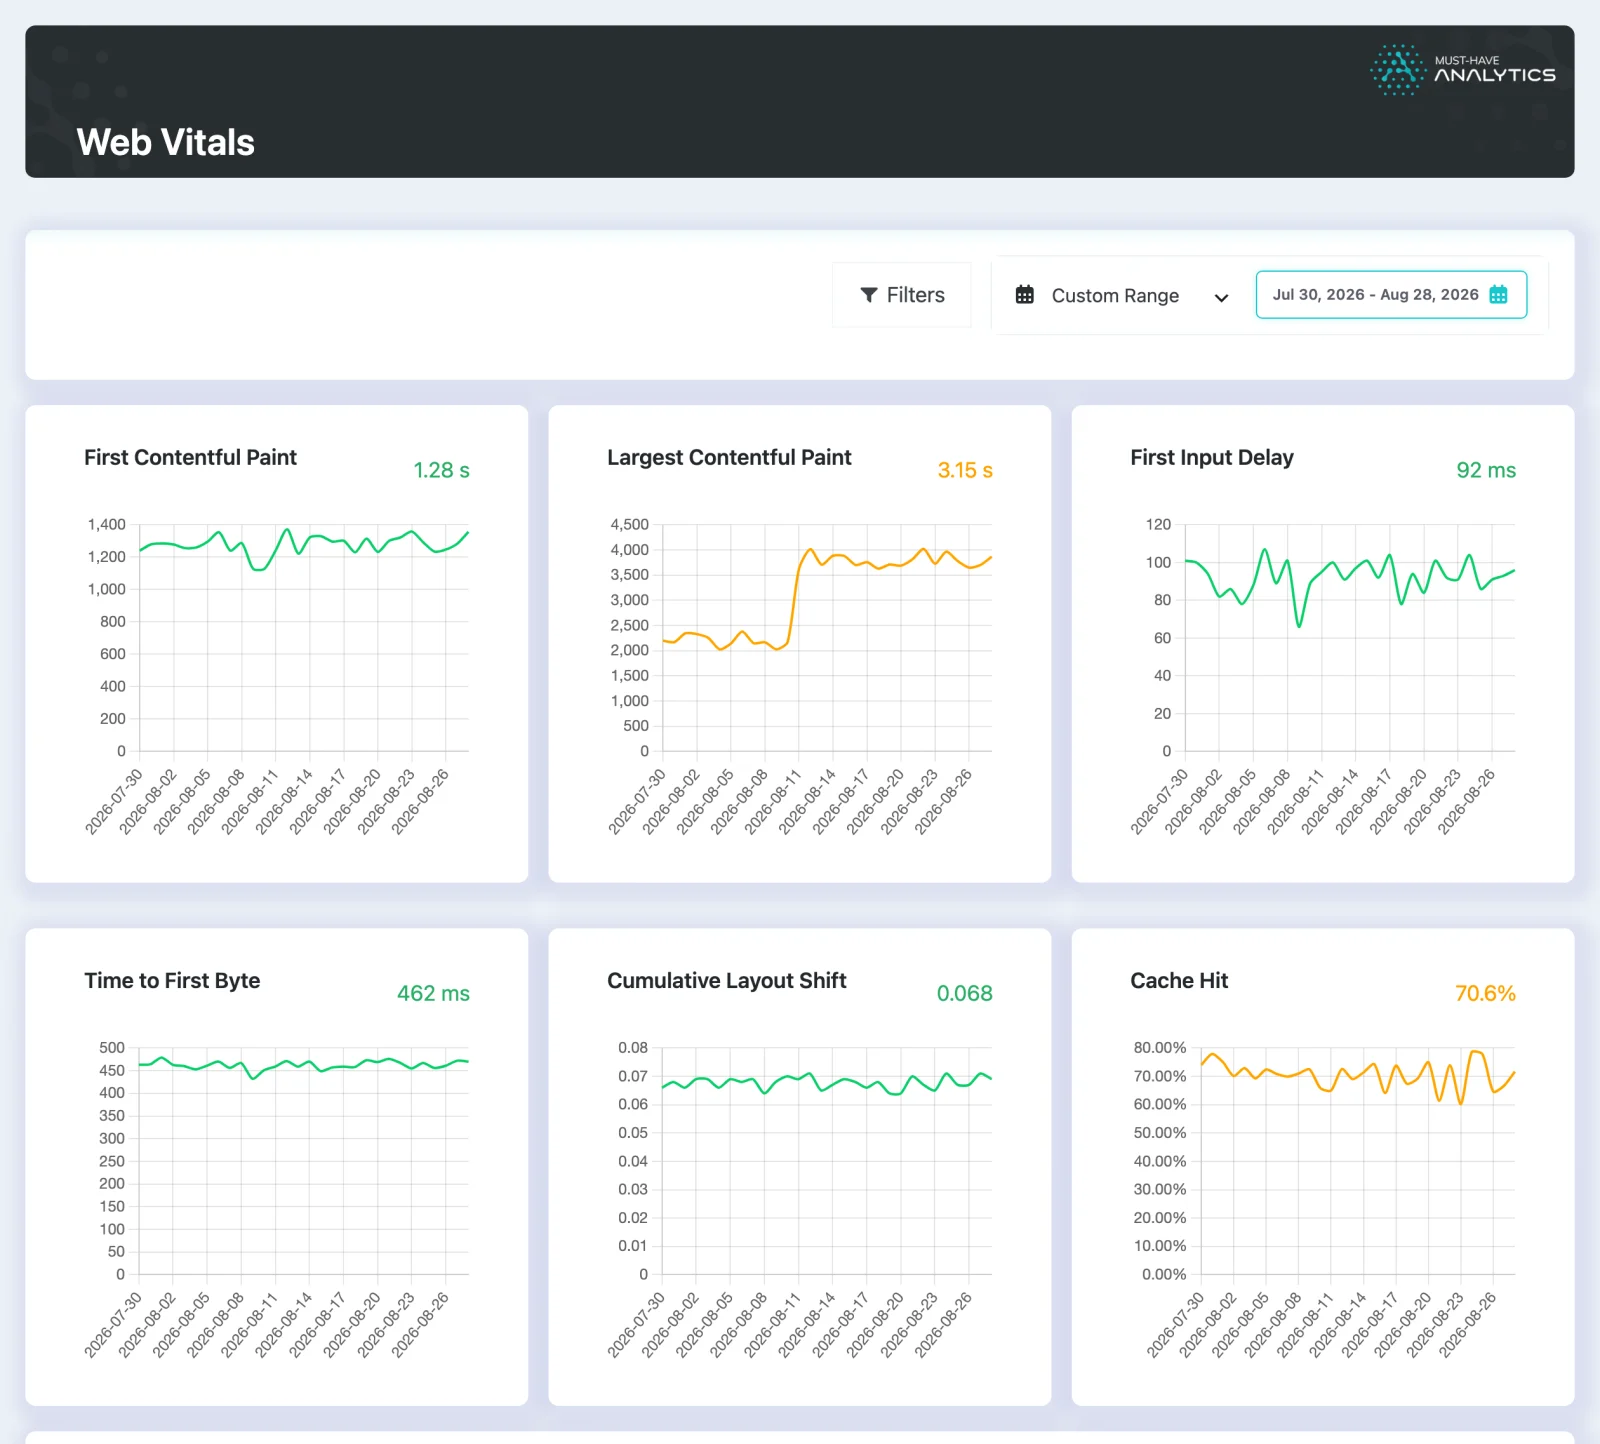
Read these charts for what they are. If Largest Contentful Paint jumps on the day you installed a new plugin, that is a strong hint, not proof. Confirm it with a lab test before you blame the plugin.
Ad platforms from the server
If you advertise on Meta or TikTok, the plugin can send store events such as product views, add to cart, checkout and purchases, and the goals you define, to Meta’s Conversions API and TikTok’s Events API from your server, with the pixel ID and access token you give it. For Google Ads it exports conversions as a CSV file that you upload. Whether you can then remove the browser pixel depends on what else you use it for, so test that before you take it out.
Server-side is not free either: your server makes these calls inside the request that records the event, and that request waits for the answer. And keeping analytics on your own site changes where the data goes, not the rules for collecting it. If your site needs consent for analytics or advertising today, it still does.
Where the data lives
Visits, sessions and events go into the plugin’s own tables in your WordPress database. Reports run as queries on that database. Most reports need an active licence.
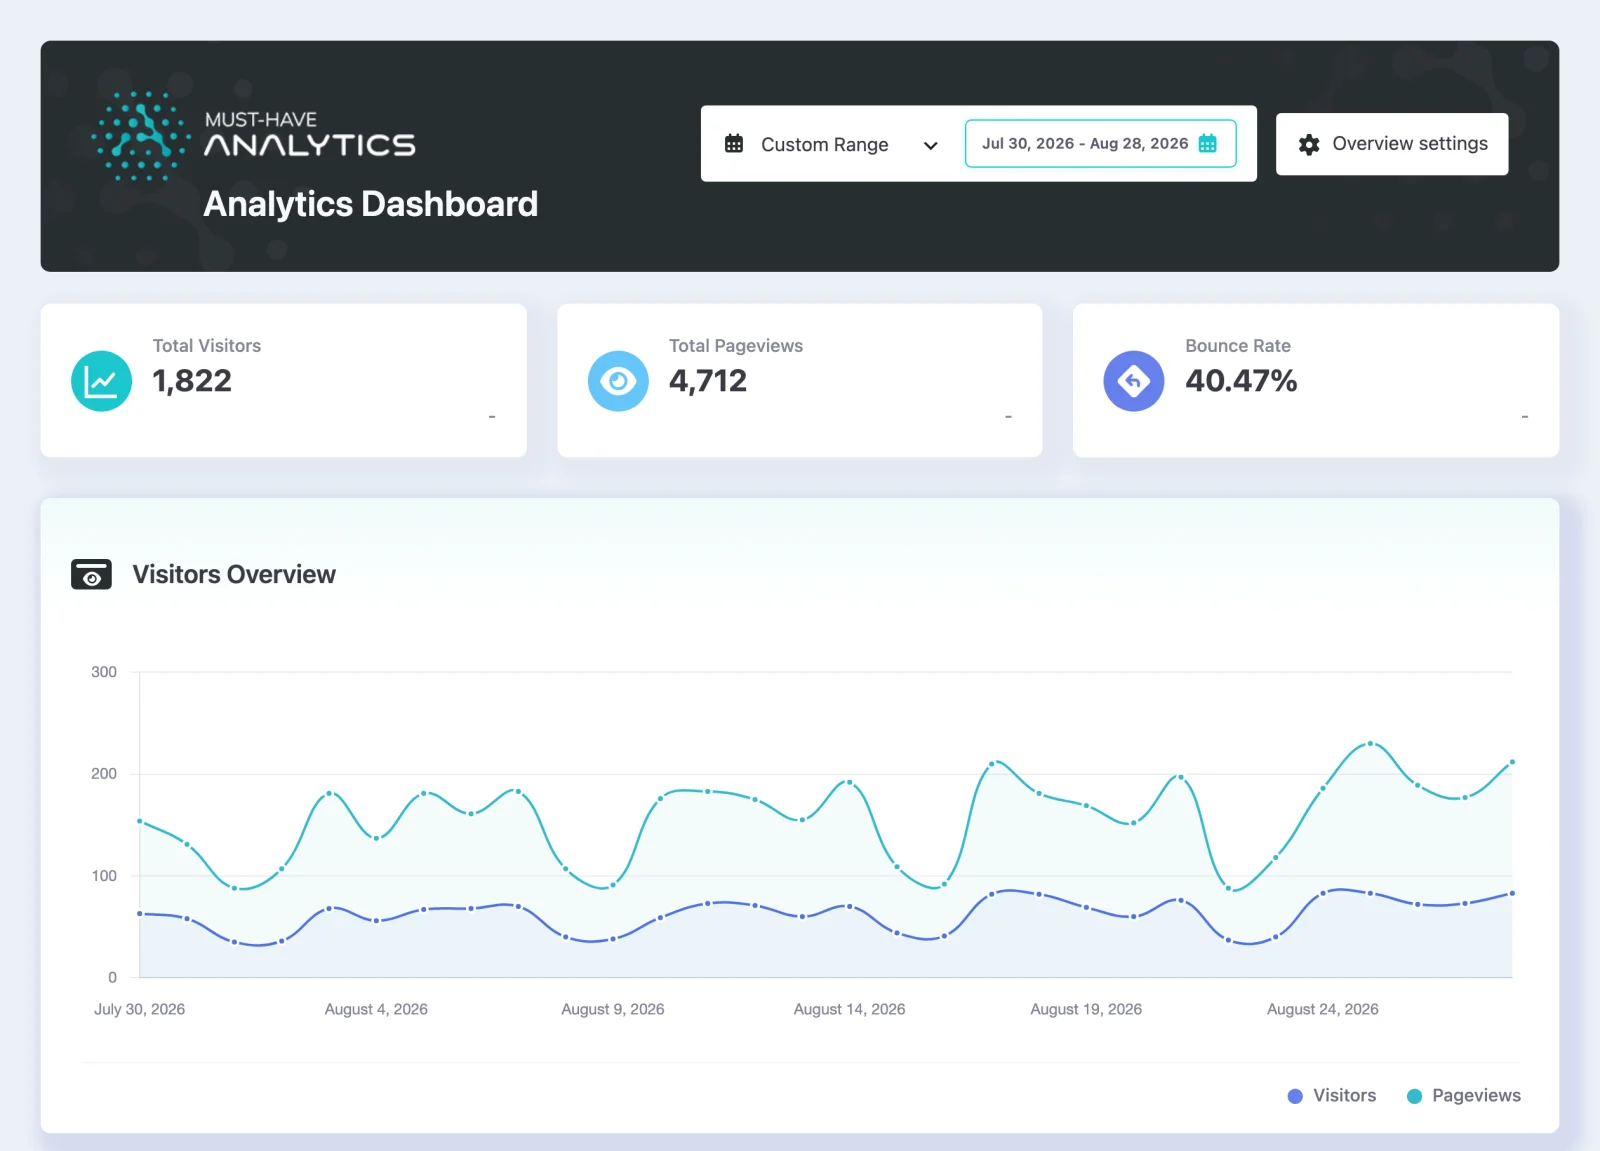
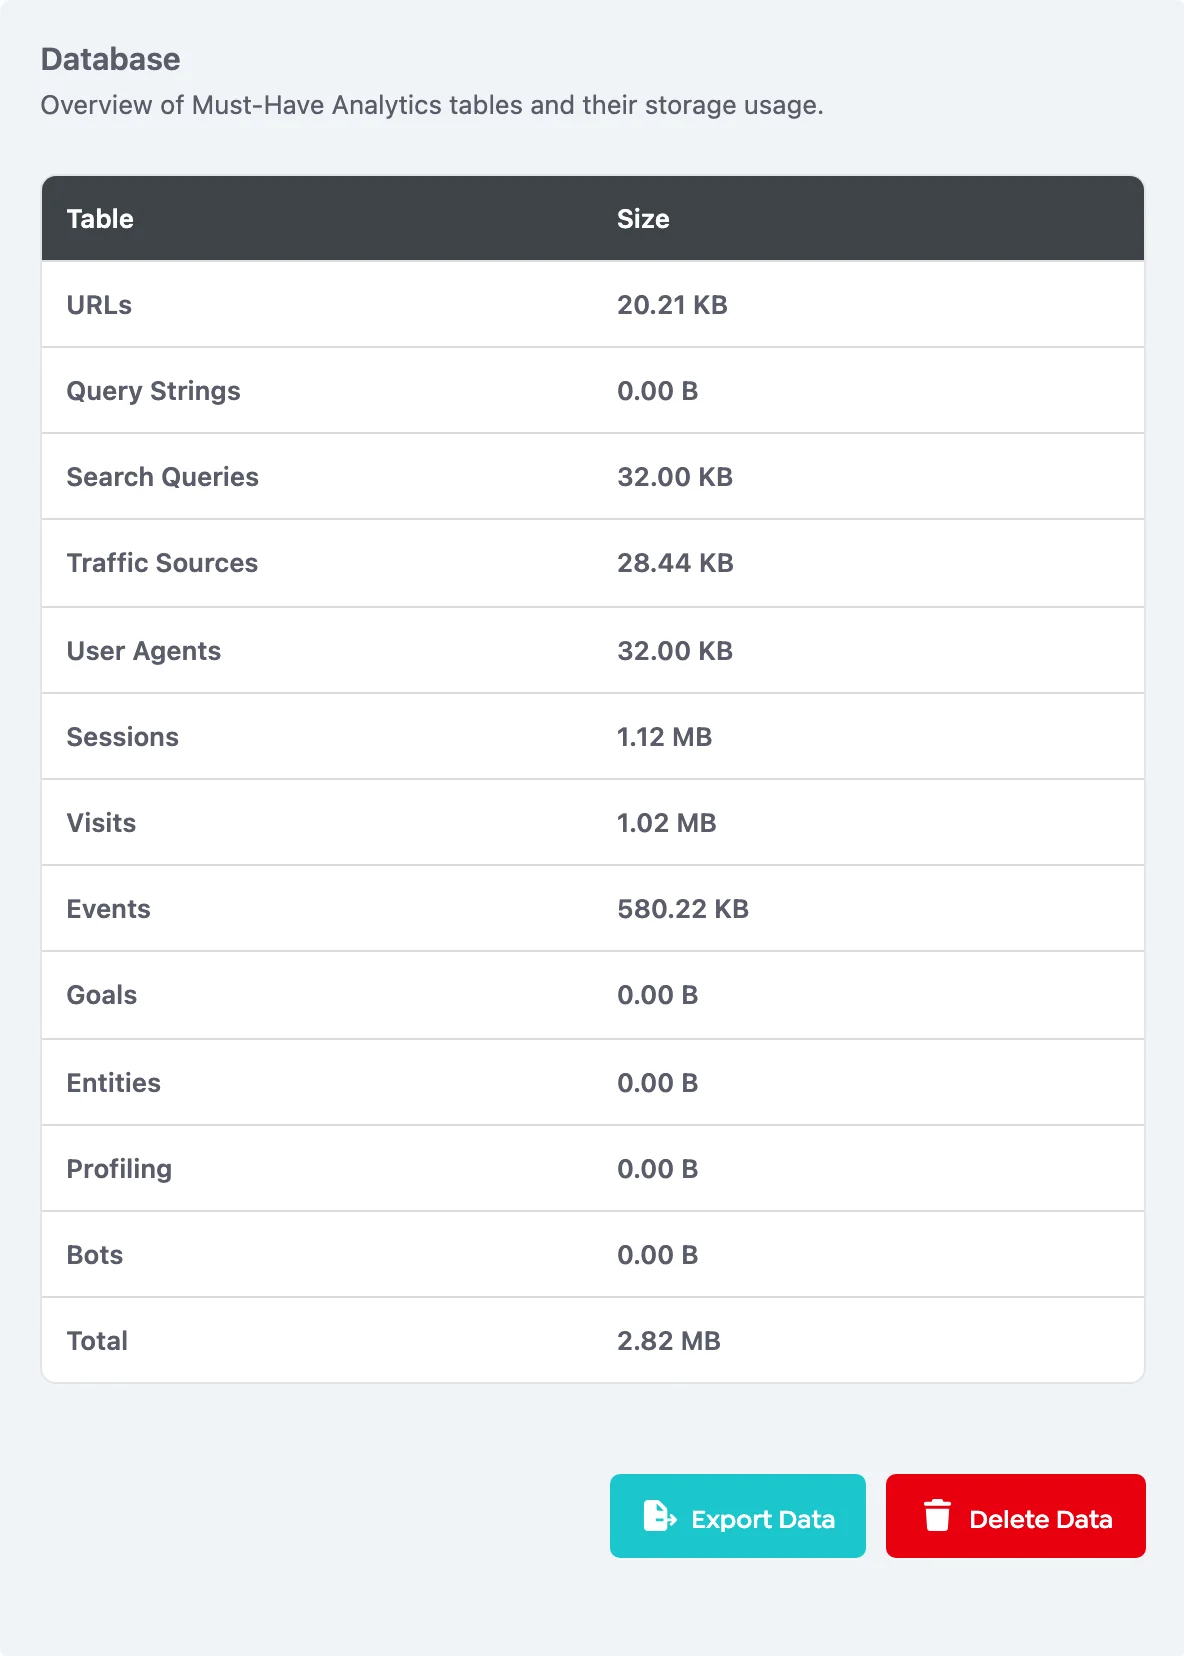
A database that keeps growing is a performance problem of its own, so it is worth watching. On our test shop, the demo data of about 4,700 pageviews in 1,800 sessions takes 2.8 MB, indexes included. The System tab of the settings shows the size of each table, raw data is deleted after 24 months by default, and you can choose anything from one month to keeping it forever. Bots are stored as daily counts only, so they barely add to the tables.
Measure, then decide
Every script on a page should earn its place, and analytics usually does. It does not have to come from other people’s servers to do it. One small file from your own site, store events recorded on the server and speed data from real visits are enough to judge the rest of your optimisation work, as long as you also count the requests they add to your server. If that is the setup you want, take a look at Must-Have Analytics.